It’s one thing to have “statistics” that demonstrate day-in, day-out challenges of recurring thefts (e.g., product, customer, employee and proprietary information) and frauds, and other activities that negatively impact the business bottom line; and, unfortunately, even the organization’s reputation. It's another to have a straight forward series of calculations that demonstrate the actual dollar impact of theft and fraud within businesses.
In business, let’s face it, our role as security leaders is to make it safe and secure, and at the same time improve profitability. What? How can the security function improve profits? Below is a process that you can adapt to any size of business. I developed this process to prove to senior managers that we shared the same focus -- to make the business more valuable; and I was going to do it with my security expertise.
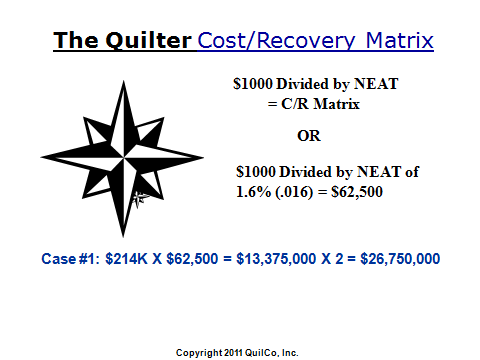
As a Certified Fraud Examiner I knew I had a unique perspective. I also knew I needed basic concepts that were direct and immediately understandable to employees, managers and the CEO. What I developed was The Quilter Cost/Recovery Matrix that you see below. Take a good look and I will explain how it works and how you can make it work for you.

At the bottom of the above cost/recovery matrix is Case #1. It was the first case of embezzlement I discovered while working in the private sector. At the time the company I was working for made a net profit, also known as Net Earnings After Tax (NEAT), of 1.6%. This profit margin was so slim that anytime there were losses due to theft, fraud, or embezzlement it really hurt the business bottom line. I uncovered a scheme by an employee who was able to manipulate business accounts to steal $214,000 over a period of three years.
Well, in a business that makes a profit of 1.6% how much revenue does the business have to generate to make a $1000 profit? The answer is $62,000. Now in cases of fraud and embezzlement there is a multiple of at least two times the loss because the organization has been deprived of these “diverted” profits because typically it takes anywhere from three to ten years to discover a fraud or embezzlement.
Again, looking at Case #1 above you will note that this embezzlement required the company to not only generate $13,375,000 to make a profit of $214,000 but it had to generate a second $13,375,000 to achieve its profit goals of a meager 1.6%. Another way of looking at this is that the company earned a profit of $214K which was secretly diverted but it still had to “make its numbers” by working (generating revenue a second time) twice as hard. At the end of the day in Case #1 the company had to generate $26,750,000 to compensate for the $214,000 that was embezzled.
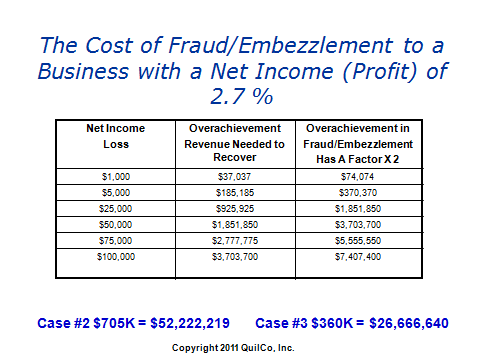
The chart below will further help to explain the cost/recovery matrix in more detail.

First, note that on this chart the Net Income for this company is 2.7%. Let me explain this chart. Below the header are three columns from left to right. The 1st column is titled Net Income Loss.
The 2nd column is titled Overachievement Revenue Needed to Recover. And the 3rd column is titled Overachievement in Fraud/Embezzlement, which has a factor times 2.
Let’s start with the left column – the Net Income Loss. Illustrated here from top to bottom are losses in amounts of $1000, $5000, all the way to $100,000. Correspondingly, the amounts in the other two columns reflect revenue needed to recover from a theft that is quickly discovered as well as theft from fraud/embezzlement which has a factor of “times 2” Because it was discovered in the 3-10 year timeframe mentioned previously.
The importance of this slide is that it draws a distinction between losses that are discovered rather quickly (the center column) and those that are not discovered for a longer period of time (the right column). Starting with the left column if you look at the $1000 line and go from left to right you will note that it takes $37,037 of gross revenue to generate that $1000 of profit.
Let’s assume that there was the theft of $1000 in cash or maybe a computer or a high def TV was stolen. We know we physically possessed the cash, the computer or the high def TV. But now it’s gone. The loss of $1000 in cash or physical assets now has to be replaced. To do this the business has to again generate another $37,000 dollars in gross revenue in order to recover loss of this cash or physical asset valued at $1000. When an organization has losses – even as minor as this – it illustrates that the business has to overachieve to meet revenue.
The business has to in effect “start all over” and make an additional $37,000 dollars to make up for the illustrated lost cash or asset. Let’s face it -- most organizations don’t think like this. This overachievement is hardly ever a part of a business plan. Making up for this loss of $37,000 “in productivity” when multiplied by 5, 10, or 50 times can sometimes lead to the failure of the business. It’s true some organizations factor in shrinkage as part of their business projections, but most do not because this can be a highly variable factor.
Now, let’s move to the far right column and look at the overachievement required as the result of fraud or embezzlement in which there is at least a factor of 2 times. Again, this multiplier is important because experience tells us instances of fraud and embezzlement can be hard to detect and can go on for anywhere from 18 months to 10 years.
So, if the loss is either a fraudulent scheme or an embezzlement then following the example in column 3 the business now has to generate an additional $74,000 of gross revenue just to recover from a $1000 fraud. As you can see, the overachievement required to make up for losses just to break even can at times overwhelm a business.
Think of the first column as whatever the loss is, as discussed it could be cash or a physical asset.
The middle column represents the additional revenue (sometimes referred to organizational effort) needed to make up for a loss. Finally, the far right column shows the negative impact fraudsters and embezzlers have on the business. This clearly demonstrates that everyone in a business should be aware of how these kinds of losses are impacting the business.
Finally, you will note that there are two cases at the bottom of this illustration. I investigated both of these cases. Case #2 was an embezzlement of $705,000. As you can see it required over $52,000,000 in overachievement. Case #3 was an embezzlement of $360,000 that required over $26,600,000 in overachievement to recover. These were 2 cases uncovered in the same company; once we discovered these we found others as well.
In closing let me share a story. One afternoon the CEO of a multi-billion dollar company called me and asked me to meet him in a small conference room. I knew it was common for him to find some quiet space and work alone like this. So I expected he just wanted to see me. Well, when I opened the door there sat the CEO, our President as well as the Chief Financial Officer. With a big smile I remember saying, “Hey guys what’s happening?” The CEO said we have only one question, "How many more of these embezzlements do you think you are going to find in the next year?” With a big smile I said, “Well if I had an answer to that I think I would be worth a whole lot more money,” at which we all broke out in laughter. I said I didn’t have a clue how many more thefts, frauds or embezzlements we might discover but that we were doing all the right things.
With their support not only were we getting the information that unearthed these losses but also their support in pursuing prosecution was going to send an important message across the enterprise. The message was, "If you steal from the company you will be fired, we will recover every possible loss from you and you will go to jail." In all the cases cited above the companies did fire these employees, we did get substantial recoveries, and the offenders did go to jail!
Answer provided by J. David Quilter, Security Executive Council Faculty Emeritus. An excerpt of David’s book, "From One Winning Career to the Next," is available here.