Created by George Campbell, Security Executive Council Emeritus Faculty member
Objective: To select a small set of security-related services and assess the potential for a return on expenses.
Results Sought: Demonstrate a measurable and beneficial contribution to the bottom line.
Strategy: In this example, we have selected four programs for which we can reliably estimate or validate expenses. We then worked with affected business units to estimate the financial impact of various incident-related scenarios. For the first three programs, the return figure is based on the likely consequence of incidents if they are allowed to proceed without security program intervention. In other words, assume the absence or failure of safeguards to prevent or mitigate the event. In the fourth program, investigations, return is based on the recoveries made for all cases started and ended in same year.
Where Is the Data? If your business is not estimating the potential for loss in a variety of events, you likely are in for bigger problems than are represented here. Having a solid grasp on the likelihood and financial implications of risk directly feeds your ability to gauge the level of protection you should provide. What’s the tradeoff between the cost of protection and the likely consequence of a variety of security incidents?
Let’s look at the examples in the graphic.
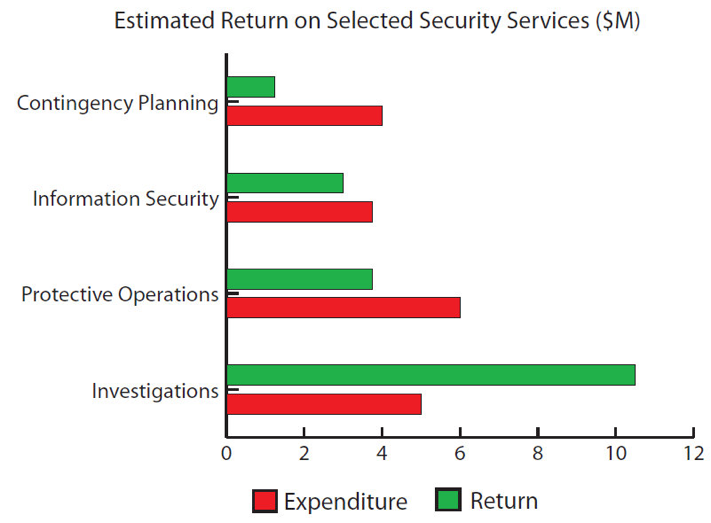 • Contingency Planning:
 A business unit owning a critical business process must be able to reliably estimate the financial impact of downtime; that is the key element of business continuity planning managed by business process owners. A highest criticality process requiring zero downtime will have data on the expected impact of extended down time on customer access, production, supply chain and other key measures. Managers need to have good data on the cost of loss of various processes on an hourly, daily or more extended basis. In this example, for a $1.2M expenditure, we know the positive results of our response to business interruption incidents in time and restoration to full functionality. We can flip that result and develop impact estimates of $3.6M if our business continuity measures failed to deliver.
• Information Security: Similarly, the uptime availability of various levels of information criticality is measured and tracked by the IT organization and often by the impacted business unit as well. Business units can estimate the impact of information compromise or loss of use internally or to customers. An example is found in compromise of customer lists, where the business has to provide fraud detection on each customer’s desktop at $X per month for Y years.
• Protective Operations: We can postulate on the impact of penetration of a protected area containing various assets, as well as the potential legal consequences of such scenarios. For example, your legal department can obtain data to gauge the civil judgment history for negligent security or the failure of a protection system resulting in the loss of a highly valued asset. Here, we show a negative return of $5.7M to an expenditure of $3.4M, which requires some serious assessment of staffing or technology if this is a trend that has persisted over an extended period.
• Investigations: As noted, our incident history or post-mortems record the value of our losses after investigation costs, insurance and replacement minus the recoveries we are able to specifically assign to those incidents in a given year.
This chart can make a real impression on management’s understanding of security’s value if you develop and present it with careful thought and solid data. Incident post-mortems and a collaborative working relationship with business unit risk management will provide the support for your estimates.