Created by George Campbell, Security Executive Council Emeritus Faculty
All security programs should be measured for performance. However, creating a truly effective and valuable measures and metrics process is not easy.
To that end we have gathered some presentation slides that successful security leaders have used in the past to demonstrate the value their Business Continuity programs are delivering to their organizations.
We are hopeful that this information will help generate ideas that you can use within your Business Continuity metrics program.
Example Presentation Slides
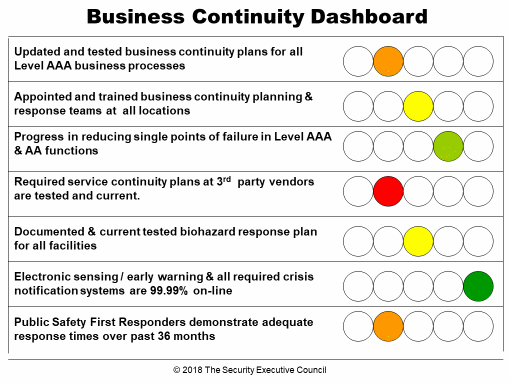
Select your several measures of effectiveness of your organization's business continuity program and monitor them monthly. This dashboard may be prepared for a specific business unit to keep them apprised of strengths and weaknesses and to hold the business continuity specialists in that unit more accountable. Charts like this need to be backed up by specific risk assessment and reporting results so that plans to fix problem areas may be appropriately focused and resource requirements obtained.
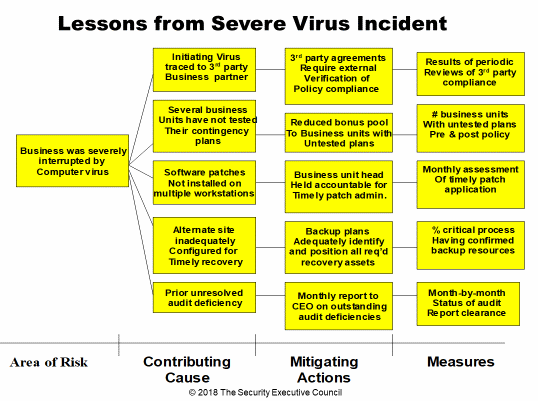
Post-incident lessons-learned are essential processes in contingency planning. Here, vulnerabilities enabled a virus where adequate risk assessment and follow-up mitigation tactics would otherwise have prevented or minimized the impact. New viruses seeking to capitalize on safeguard weaknesses are always a risk. But having a resilient and proactive risk management strategy, directly aided by incident post mortems, will enable you to do better than the competition.
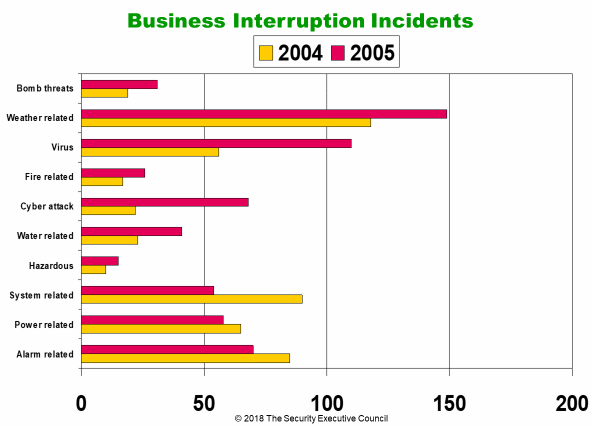
Here is a simple informational chart that may be part of an overall "state of security" briefing. Breaking this type of information out for an individual site with more extensive incident details can help in the awareness area as well as cause rethinking on the adequacy of the backup strategy or the location of particular assets there.
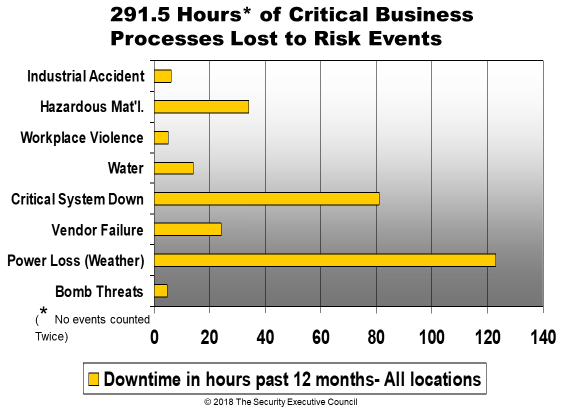
What would 291.5 hours of critical business process downtime cost in your company? This slide should be in a presentation on contingency planning to emphasize the need for a strong offsite strategy, increased redundancy and perhaps more in-depth planning in specific sites with higher probabilities of outages.
In addition, this slide should drive a companion on lessons learned from several of the higher impact events. Likely there are common denominators that contribute to more extended downtimes.
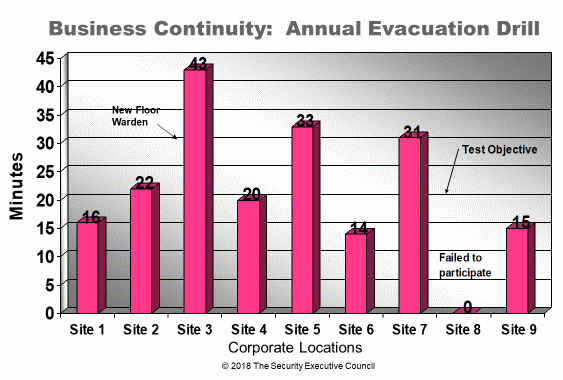
This is a very revealing display that highlights those who are paying attention to a serious employee safety objective and those who should attract management's attention during performance reviews. Note the test objective that obviously has to be adjusted for each set of sites where the logistics of reasonable evacuation timelines dictate. The new Floor Warden is noted to give slack to this individual but also to highlight the focus on the next exercise.
Post 9/11, these drills are increasingly high on the risk management agenda and in this hypothetical example the responsible manager at site 8 may be updating a resume in an organization that takes this aspect of risk management seriously.
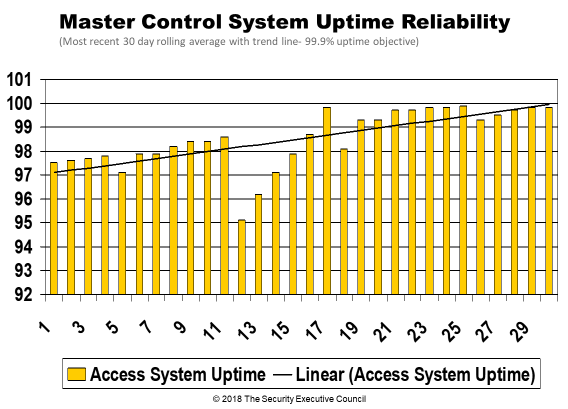
Tracking critical systems for reliability is an imperative. Mean time between failures for systems, subsystems and components drives your back-up strategy and contractual relationships with key vendors. In this example, a 99.9% uptime goal has been set and is measured in minutes or hours. IT departments maintain rigorous records on uptime reliability. For critical components or systems, a reliability measure should be incorporated in RFPs and contractual documents.
Next Steps
The Security Executive Council has some of the world's renowned experts on security measures and metrics programs available to assist you with starting or optimizing your program.
Contact Us to discuss how we might be of help to you.


